In 2015 I bought my first Bitcoin, and it only took a few months for the value of my holdings to increase substantially. This got me thinking that perhaps cryptocurrency was another way for me to diversify my income. Perhaps I could learn how to trade Bitcoin to take advantage of the price swings. That is where I started to learn how to use cryptocurrency charts.
What is Cryptocurrency?
 Before I get into talking about charts, I want to make sure everyone understands what cryptocurrencies are. You may be familiar with bitcoin, however I find that there are enough people out there who don’t have a good understand that it is worth quickly reviewing.
Cryptocurrency is a digital form of currency that is encrypted and facilitates the trade of goods. Here is Wikipedia’s definition:
“A cryptocurrency (or crypto currency) is a digital asset designed to work as a medium of exchange using cryptography to secure the transactions and to control the creation of additional units of the currency…Bitcoin became the first decentralized cryptocurrency in 2009.”
The industry has come a long way since 2009 when Bitcoin came on the scene. Today there are multiple cryptocurrencies, with the most popular being Bitcoin, Ethereal, and Litecoin. Each of these are similar in concept, but offer different benefits and disadvantages. That is beyond the scope of this article, but will be the content of a future post. If you do want more information on what exactly cryptocurrency is, then a good resource is the blog at Coinbase.
For those of you looking for ways to generate additional income, the key to cryptocurrencies is that they can be traded like a stock or commodity. Bitcoin traders look to make money by buying and selling the currency, trying to capture discrepancies in the value currently being offered on the cryptocurrency market. More on that later.
Cryptocurrency Exchanges
Before I cover charts, I want to make sure I talk about cryptocurrency exchanges. Like the stock market, cryptocurrencies rely on exchanges to facilitate buying and selling. There are a few exchanges available out there, however the one I have the most experience with is Coinbase. It is important to find a solid exchange, and Coinbase has a secure and easy to use platform.
The signup process is simple and only requires some key information, including linking your bank account so you can transfer bitcoin into dollars (or visa versa). From there you simply buy or sell the currency as you see fit. In order to use cryptocurrency charts you will need an exchange like Coinbase to facilitate your trading.
Next, to actually trade cryptocurrencies, you have to understand where charts fit in.
What are Cryptocurrency Charts?
Cryptocurrency charts are similar to charts that stock traders use to buy and sell stocks. These charts are a visual representation of the price of an asset over a specific time period. The y-axis (vertical axis) represents that price and the x-axis (horizontal) represents time. Here is an example of the stock chart for Apple:
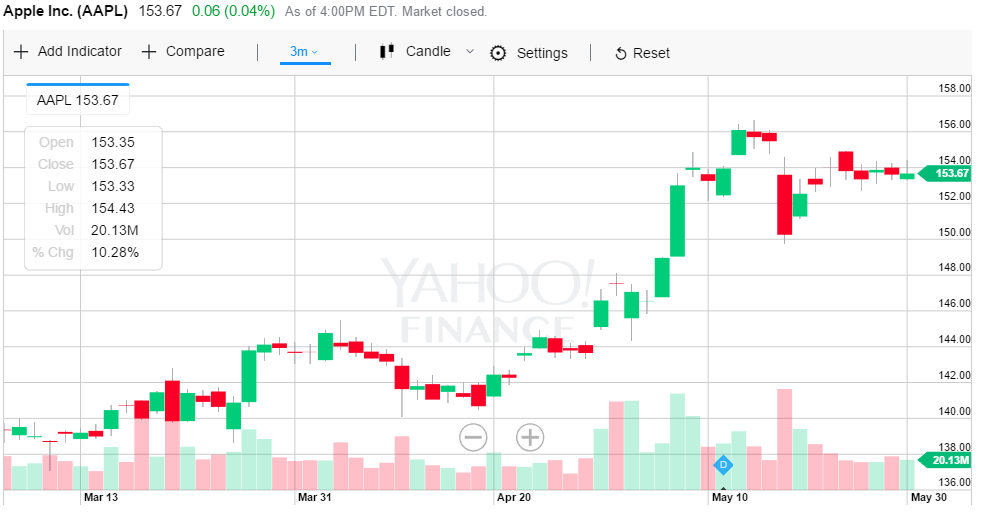
Stock traders use a chart like Apple’s to make decisions on when to buy and sell the stock. Reading the “price action” of the stock on a daily basis (or whatever time frame) helps to inform the trader of what might happen next. With that information, decisions are made to make money by deciphering the patterns the prices make on the chart.
Like stocks, cryptocurrencies like Bitcoin, Ethereal, and Litecoin go up and down in price, and create chart patterns that a currency trader can use to make money. Here is an example of a Bitcoin chart:
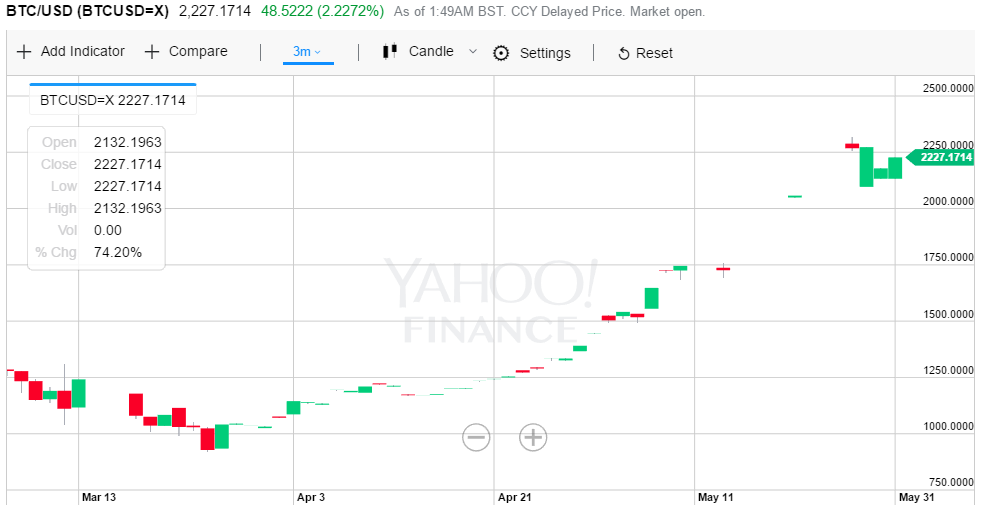 The way to read this cryptocurrency chart is simple. The green candlesticks represent days when the price of Bitcoin went up, whereas the red candlesticks are down days. Since early April, the price of Bitcoin has seen a huge increase from around $1,100USD to today’s value of $2,227USD.
What Type of Chart Should You Use?
There are a number of types of charts available. For example, charts can be line charts, area charts, OHLC, and bar charts to name a few. However you should really only focus on one type. The charts I used above, and that I use in my trading, are called candlestick charts and offer the following benefits to anyone interested in trading:
- Tells you what the currency opened at, closed at, and the range of prices during the chosen time period on the chart.
- Tells you if the price is going up or down.If the candlestick is green, the stock closed at a higher price than what it opened at. If the candlestick is red, then that tells you the stock closed down.
- Tells you the trend. By looking at the trend of the prices, you can easily see if the price is trending up or trending down.
That information is critical to have if you want to be a successful cryptocurrency trader. Another thing that is important is the time frame you choose on your cryptocurrency charts. On the charts above, I showed you 1-day charts, meaning that each candlestick represents one day of trading. You can choose whatever time frame you want, with the most common being 1-month, 1-day, 15 minute, 5 minute, and 1 minute.
The shorter time periods are best used if you are focusing on trading using very short time periods – like daytrading where you may buy and sell bitcoin multiple times per day. If you are after longer term trend, then using 1-day or even 1-month charts can be useful.
Let’s now turn our attention to using cryptocurrency charts to start trading.
The Most Important Factors When Using Charts?
Most currency traders get caught up in all sorts of complex system to try to make money. However, in my experience, these same traders don’t spend the time to learn the fundamental basics of trading.
When reviewing cryptocurrency charts, here are the most important things to look for right off the bat:
- Whether the price is rising, as indicated by a green candle, or
- If the price is falling, as indicated by a red candle, and
- Whether the trend of the prices on the chart are in an uptrend, or heading higher, or
- Whether the trend of the prices on the chart are in a downtrend, or heading lower.
If you take the time to nail these down, you are ahead of 90% of the amateur traders out there. The reason is that to be successful, it is much easier to trade with the trend than against it. For example, cryptocurrencies tend to follow the trend they have been on. If they have been heading higher, they have a tendency to continue heading higher in price. If they are going down over time, then they likely will head lower for a period of time.
That said, trading cryptocurrencies is hard no matter how good at reading cryptocurrency charts you get. The price of currencies like bitcoin are very volatile. Many things can happen in the market which influence price, and you have no way of knowing what all of those are. Even in the strongest of uptrends, something can happen to turn that uptrend into a downtrend very fast. It is very important to recognize that and continue to practicing reading the charts.
My recommendation is to sign up for a Coinbase account and get ready to trade. However, before you actually use real bitcoins, practice trading them by reading the charts and pretending to buy and sell them based on the signals you get. Build up your skill with “play” currency first, and then when you become more skilled start to slowly trade. This method will help you manage your risk of blowing up your account.
Give Us Your Input!
Have you had success trading cryptocurrency using cryptocurrency charts? If so, let us know what worked for you in the comment section below.
Good article :_) and information you shared in this article is very useful.
Liberalcoins is a local Bitcoin, Monero, Dash and Litecoin exchange. Users can directly buy and sell cryptocurrencies to each other
Your article is quite informative for beginners but one thing missing in this article that you didn’t mention about a platform that which is the best wallet to trade cryptocurrency. When I started trading cryptocurrency I had taken help from a website which provides me genuine reviews and ratings of cryptocurrency trading platform which was really worthful. I am sharing the link below that helped the beginner to trade easily.